Every single day Quote by Cole Nussbaumer Knaflic
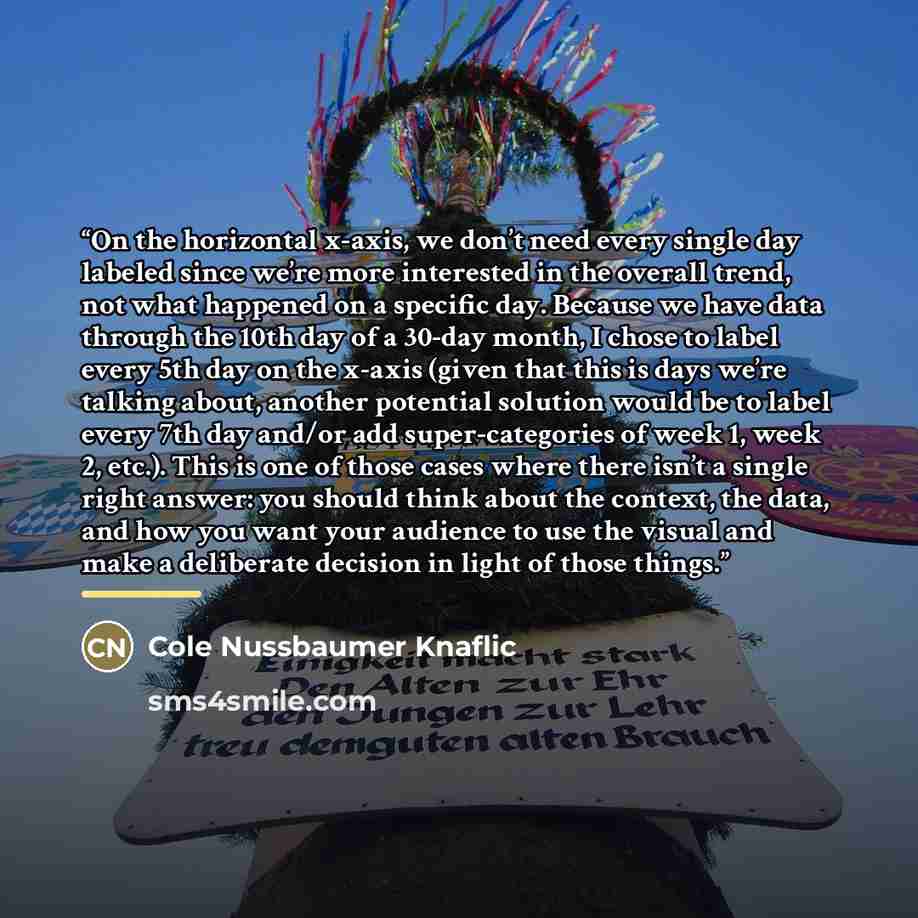
““On the horizontal x-axis, we don’t need every single day labeled since we’re more interested in the overall trend, not what happened on a specific day. Because we have data through the 10th day of a 30-day month, I chose to label every 5th day on the x-axis (given that this is days we’re talking about, another potential solution would be to label every 7th day and/or add super-categories of week 1, week 2, etc.). This is one of those cases where there isn’t a single right answer: you should think about the context, the data, and how you want your audience to use the visual and make a deliberate decision in light of those things.””
About This Quote
Source Book: Storytelling with Data by Cole Nussbaumer Knaflic, 2015
Effective visual communication requires selective labeling to highlight trends without clutter, balancing clarity and context.
In simple terms: Choose labels that aid interpretation.
Key Takeaway
Label strategically for clearer charts.
Themes
data visualization
communication
clarity
Mood
analytical
practical
Type
educational
technical
When to use this quote
- presentations
- reports
- dashboards
- infographics
Key Concepts
design principles
audience perception
contextual relevance
Questions to Reflect On
- What labeling strategy best serves your audience?
- How do you decide which data points to emphasize?
A Different Perspective
Over‑labeling can overwhelm viewers; under‑labeling can obscure meaning.