Expected Quote by John Tukey
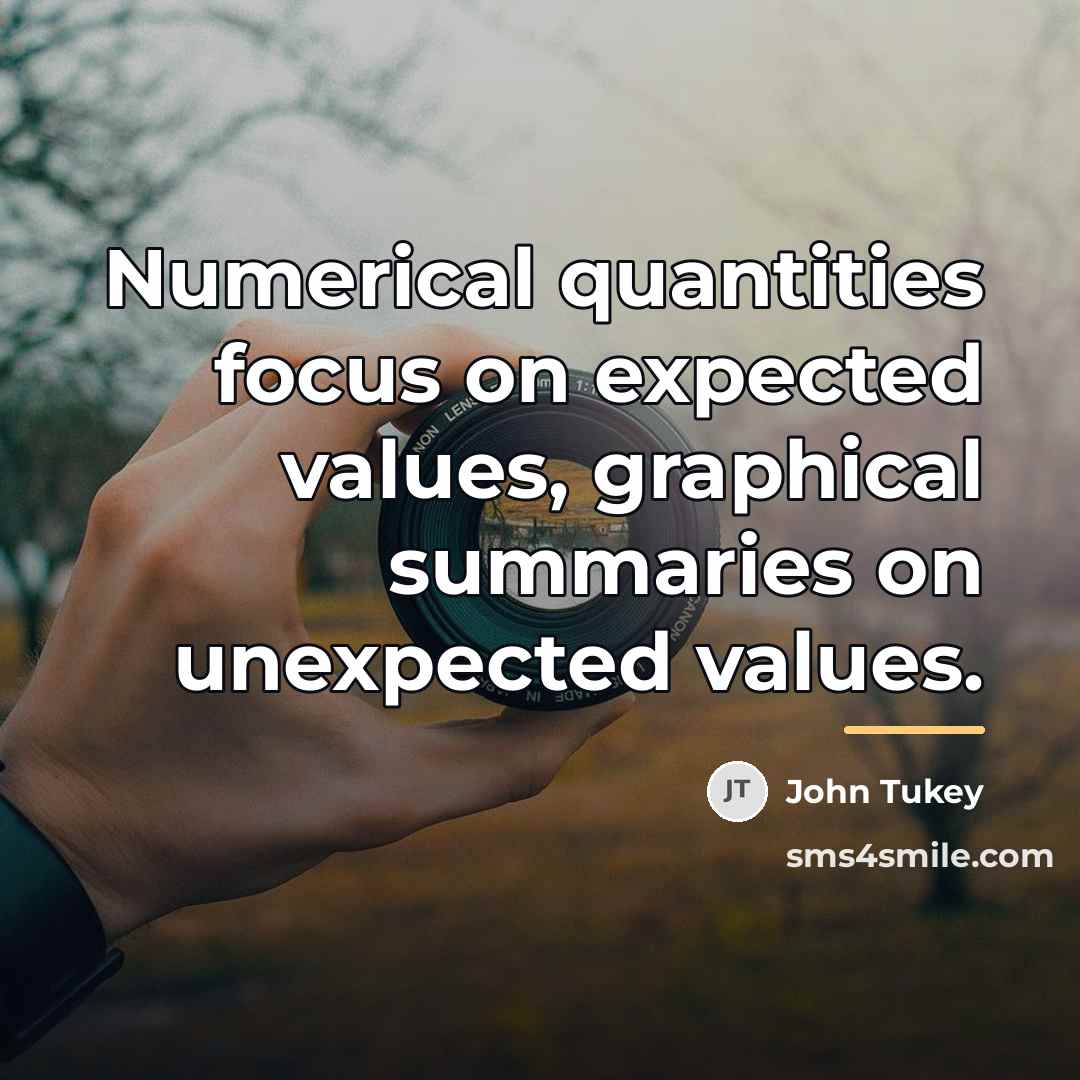
“Numerical quantities focus on expected values, graphical summaries on unexpected values.”
About This Quote
Statistical methods differ: numbers summarize expected trends, while visual graphics reveal surprising outliers.
In simple terms: Numbers show averages; graphics show surprises.
Key Takeaway
Use both to fully understand data.
Themes
statistics
data analysis
visualization
Mood
analytical
inquisitive
Type
educational
insightful
When to use this quote
- business reporting
- scientific research
- policy making
- market analysis
Key Concepts
probability
exploratory data analysis
Questions to Reflect On
- What hidden patterns might you miss without graphics?
- How can expected and unexpected data guide decisions?
A Different Perspective
Relying only on one view can miss critical insights.